We hand over a lot of topographic survey drawings. Some go straight to experienced civil engineers who know exactly what to look for. Others go to project managers, architects or landowners who are seeing one for the first time. This post is for the second group. It explains what is on a topographic drawing, how to read it, and the checks worth doing before anyone starts designing on it.
If you want the background on how the survey itself is carried out, see our earlier guide, Topographic Survey in Saudi Arabia: What It Includes and How It Is Done.
Start with the title block
It sounds obvious, but the title block answers questions people often forget to ask. Look for:
- Coordinate system. We work in WGS84, usually shown as UTM coordinates (Riyadh, for example, falls in UTM zone 38N). Some older drawings still use Ain el Abd 1970 or a local project grid, so always check which one you have. Mixing them up can shift everything by tens or even hundreds of metres.
- Height datum. Levels should be tied to a known national or project benchmark. If the drawing uses an assumed local datum, levels can’t be compared with other drawings.
- Scale and units. Usually 1:500 or 1:1000 for site plans, in metres.
- Survey date. Sites change fast. A survey from two years ago may not show new roads, buildings or spoil heaps.
- Revision number and surveyor. So you know you have the latest version and who to ask.
Spot levels
The small numbers with a dot or cross scattered across the drawing are spot levels, the height of the ground at that point. They are usually in metres to two or three decimal places. A level of 612.45 means that point is 612.45 m above the height datum.
Spot levels are taken at changes in slope, at the top and bottom of kerbs and walls, at the edges of roads, on manhole covers and at regular intervals across open ground. On flat sites they matter more than contours, because the contours may be too far apart to show small falls that control drainage.
Contours
Contour lines join points of equal height. They are generated from the spot levels and give a quick feel for the shape of the land:
- lines close together mean steep ground, lines far apart mean gentle ground
- contours that form V or U shapes pointing uphill usually show a wadi or drainage channel
- closed loops show a mound or a depression, so check the levels to tell which
The contour interval is normally stated on the drawing, typically 0.25 m, 0.5 m or 1.0 m. Keep in mind that contours are interpolated between measured points. For detailed design, the spot levels are the true data.
Features and symbols
Everything visible on the surface is picked up and drawn with a standard line type or symbol: buildings, walls, fences, gates, kerbs, road edges, road markings, trees, light poles, overhead lines, manholes, valve chambers and so on. There should always be a legend explaining the symbols. If a symbol isn’t in the legend, ask.
A few details are often missed:
- Manhole invert levels. A topo survey shows the cover level. Invert levels and pipe sizes are only included if the scope asked for manholes to be opened and measured.
- Building levels. Finished floor levels and threshold levels are useful for new connections, but again they need to be in the scope.
- Overhead lines. Pole positions are usually shown, but sag heights are only measured if requested.
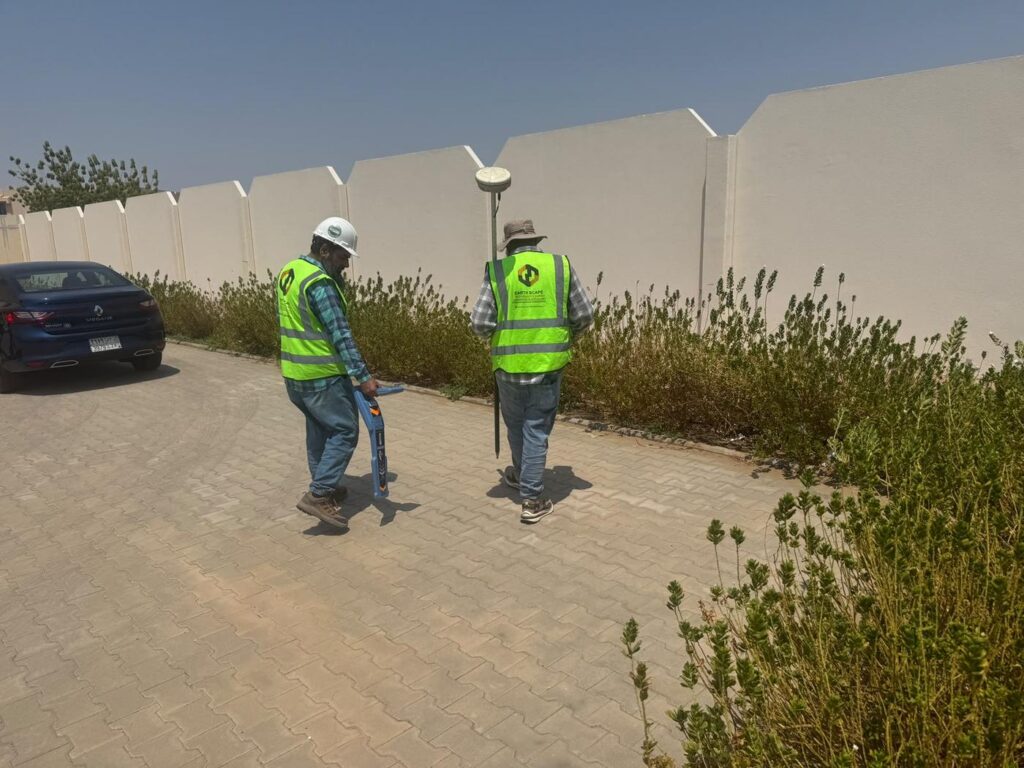
- Underground services. A topographic survey only shows what is visible at the surface. Buried pipes and cables need a separate GPR and utility survey.
Control points
Every good topo drawing shows the survey control stations used, with their coordinates and levels listed in a table. These are the points the survey hangs on. Contractors will use them later for setting out, so they need to be protected on site. If they are lost or disturbed, the next survey has to re-establish them, and small differences can creep in.
Checks to do before you design
Before the design team builds on the survey, a few quick checks can save a lot of trouble later:
- Does it cover the whole area you need? Including tie-ins to existing roads and services just outside the boundary.
- Is the coordinate system the one your design uses? Confirm it in writing.
- Do a few levels make sense? Compare a known level, such as a road or benchmark, with an older drawing or what you see on site.
- Is it recent enough? If work has happened on site since the survey, ask for an update of those areas.
- Do you have the CAD file, not just a PDF? The design team needs the DWG with 3D points and a surface model, not just a printed drawing.
What you should receive from the surveyor
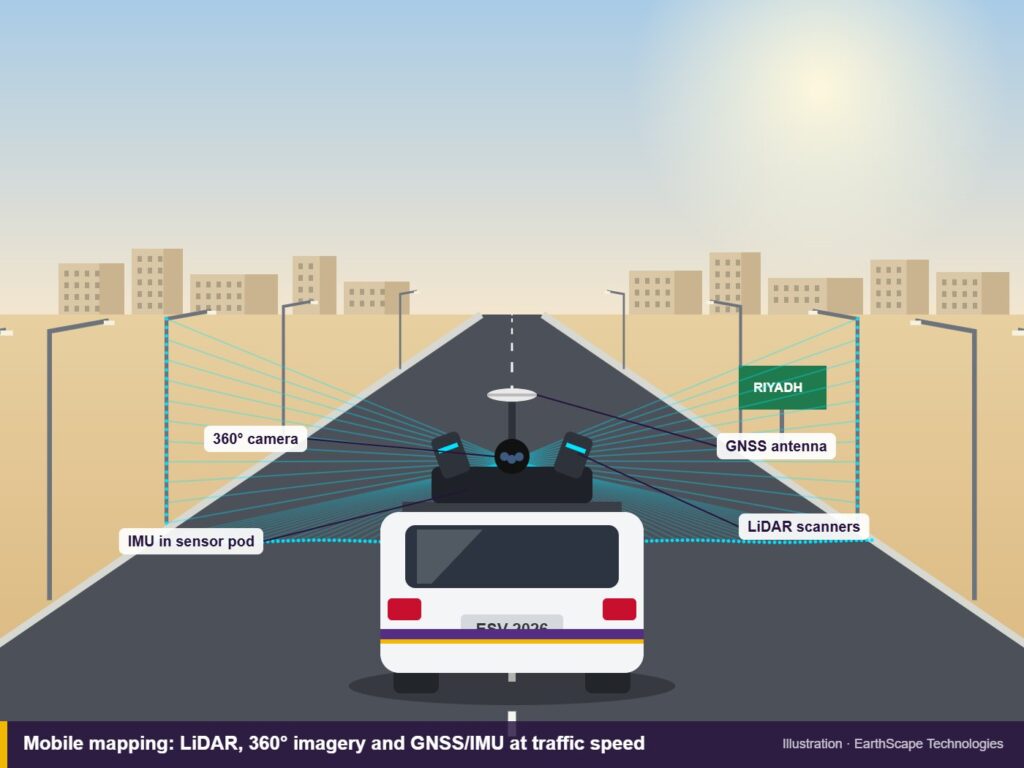
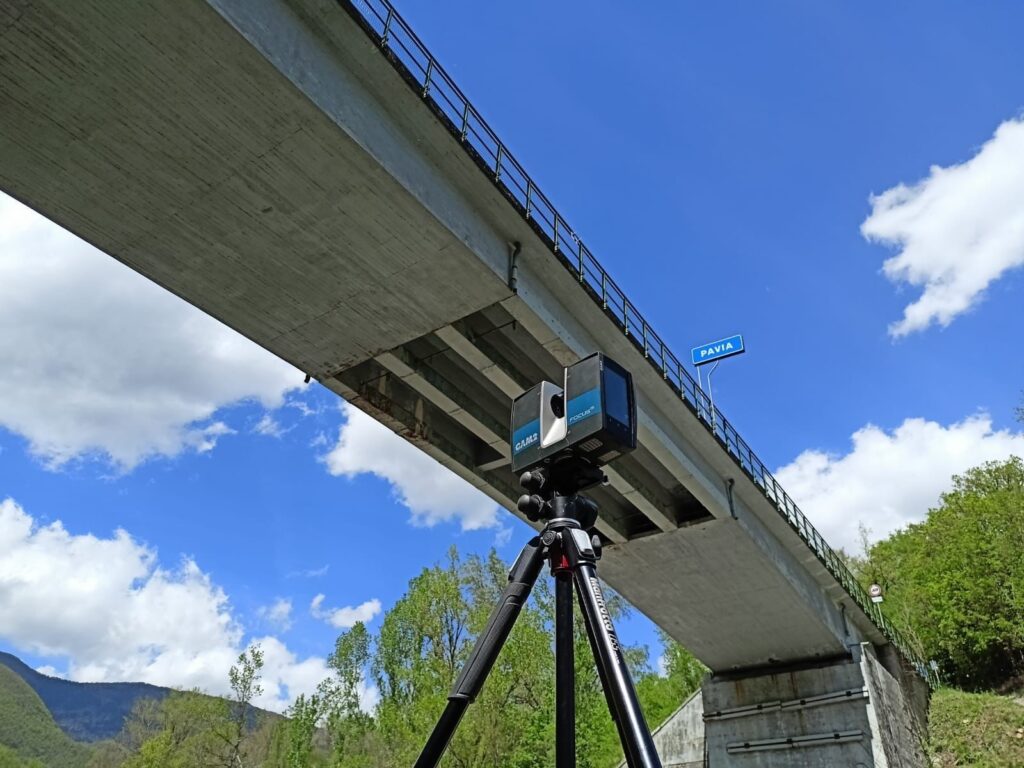
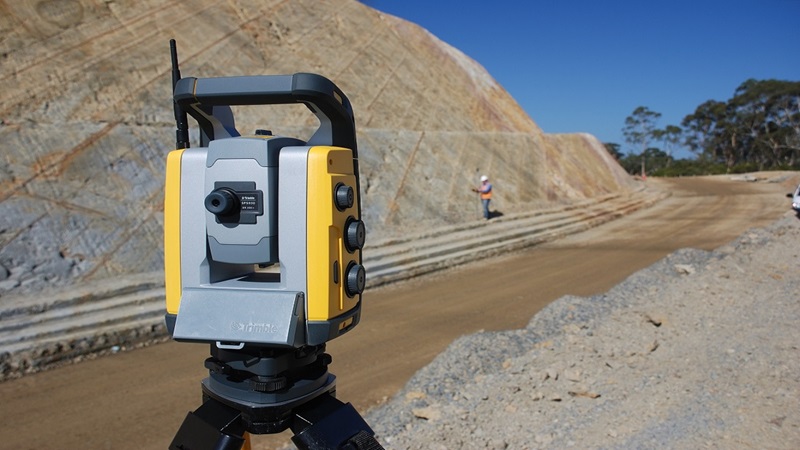
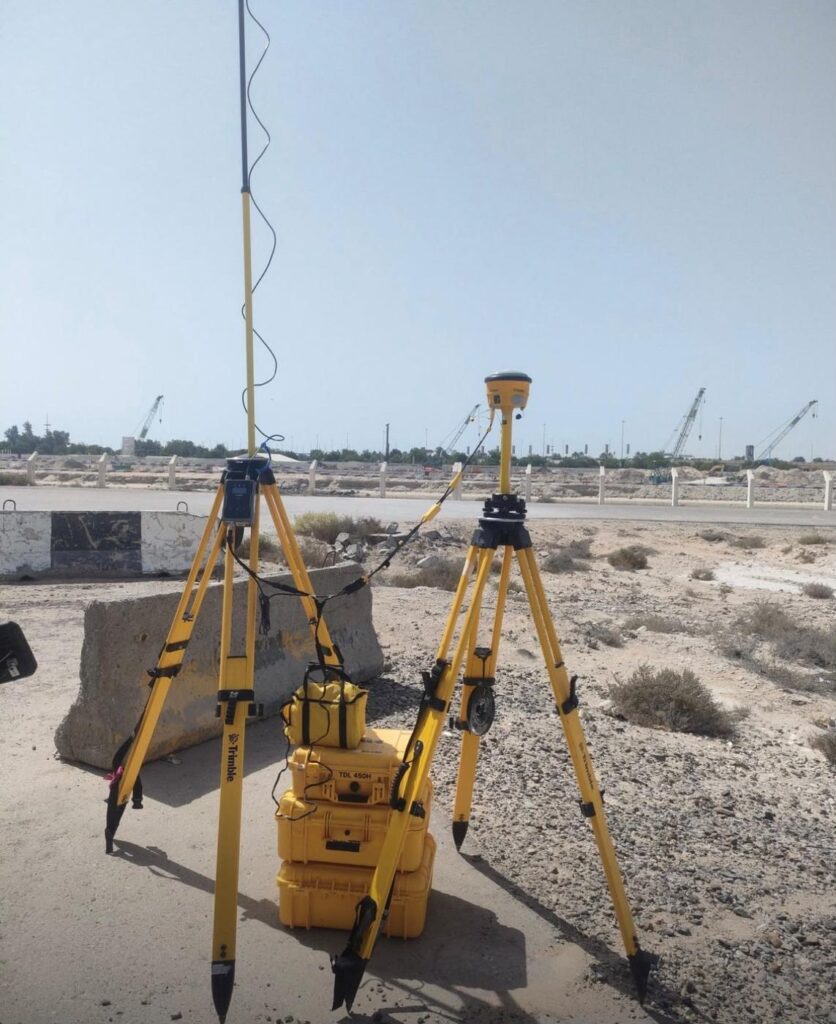
For most projects we deliver a signed PDF drawing, a CAD file (DWG) with 3D points, breaklines and contours on separate layers, a surface model if requested, the control point list, and a short survey report explaining the method, equipment and accuracy. For large or difficult sites we may use a drone survey or 3D laser scanning alongside GNSS and total station work, and the deliverables are adjusted to suit.
Frequently asked questions
What scale should a topographic survey be?
For most building and infrastructure sites, 1:500 is common. Larger sites and route surveys are often presented at 1:1000 or 1:2000, with detailed areas shown at larger scales.
Why don’t the contours match the spot levels exactly?
Contours are interpolated between measured points, so they are a smooth approximation. Spot levels are the measured values and should be used for detailed design.
Does a topographic survey show underground utilities?
No. It shows surface features such as manhole covers and valve boxes. Buried services need a utility survey using GPR and cable locating.
Need a topographic survey?
EarthScape carries out topographic surveys across Saudi Arabia using GNSS, robotic total stations, drones and laser scanning, with CAD drawings prepared by our in-house team. Send us your site location and scope through our Get a Quote page.